


Health Inspection of restaurants
Inspections of restaurants were conducted using checklists titled “Health Inspection Checklists for Restaurants” in two phases. The first phase involved traditional inspections through visual assessment. The second phase included inspections using measuring tools and equipment, such as measuring food contact surfaces, thermometers, hygrometers, and oil testers, to monitor and control the restaurants. Figure 1 presents the findings from restaurant inspections conducted in two phases, categorized into four areas: personal health, food hygiene, health tools and equipment, and building health, as outlined in the health inspection checklist. A “yes” response indicates adherence to health guidelines, while a “no” response represents noncompliance. In the initial phase, which utilized visual inspection methods, the compliance rates for the four categories were as follows: 58.93% for personal health, 55.00% for food hygiene, 48.31% for health tools and equipment, and 68.88% for building health. Conversely, the second phase, which employed measuring instruments, showed significantly higher compliance rates of 90.05% for personal health, 93.39% for food hygiene, 92.29% for health tools and equipment, and 85.54% for building health. The notable differences between the two phases can be attributed to the incorporation of measurement tools in the second phase. These tools facilitated the evaluation of environmental conditions such as temperature and humidity within the building health category, as well as the assessment of food contact surfaces and cooking temperatures in the food hygiene category. Additionally, handwashing practices were evaluated in the personal health category, and refrigerator temperatures were monitored in the health tools and equipment category.

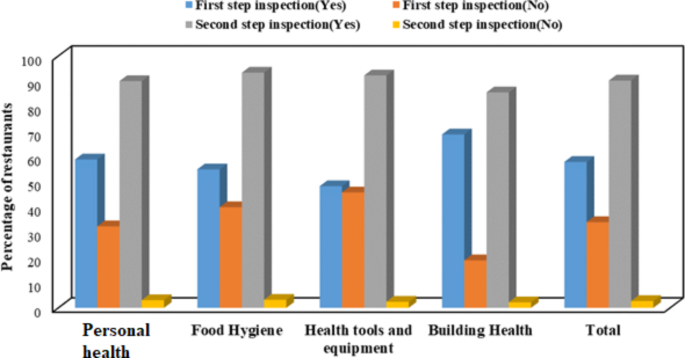
Comparison of restaurant health compliance rates across two stages of inspection: Visual inspection (First step) vs. health guidelines with measuring equipment (Second step).
Table 1 summarizes the results based on the health inspection checklist. The data revealed that during the first step of the inspection, which involved a visual assessment, the surveyed restaurants received the following ratings: 7.14% rated as excellent (A), 35.71% as satisfactory (B), 46.43% as needing improvement (C), and 10.71% classified as unacceptable (suspected or unrated). In contrast, the second step of the inspection, which employed measuring instruments, showed a significant change in ratings: 64.29% of restaurants were rated excellent, 28.57% satisfactory, 7.14% needed improvement, and notably, none were deemed unacceptable. Furthermore, a similar study by Janet Fleetwood emphasized that when inspections are conducted effectively, mandatory hygiene ratings can function as a powerful public policy tool. This approach has the potential to enhance transparency, improve public health, and empower consumers to make informed choices26.
The difference between the first and second stages of health inspections in restaurants can be attributed to the visual inspection conducted in the first stage and the use of measuring devices in the second stage. This suggests that restaurant ratings cannot rely solely on visual assessments. A significant portion of this difference in ratings is due to the measurement of microbial contamination on food contact and non-food contact surfaces, temperature and humidity control in the kitchen environment, the microbial quality of drinking water, food assessments—including oil testing—and compliance with health guidelines.
Relative humidity and temperature control
The average temperature and relative humidity in the kitchen environment were 35.89 °C and 29.41%, respectively. In comparison, a study by Angui Li et al. on temperature and humidity in commercial kitchens found that the average cooking temperature across four kitchens ranged from 18.2 to 31.5 °C, while the relative humidity varied between 60.9% and 65.7%28. Additionally, Ghasemkhani and Naseri, who monitored indoor air quality in a kitchen in Tehran, reported that a relative humidity below 30% leads to dry air, which can negatively affect the eyes, skin, and mucous membranes. On the other hand, relative humidity above 60% promotes the growth of pathogens and allergens28. When comparing these findings with those from Angui Li et al. and Ghasemkhani et al., it was observed that the ambient temperature in the studied restaurants was favorable. However, the relative humidity was notably lower, likely due to inadequate ventilation. Specifically, 42.86% of the restaurants had humidity levels below 30%, which contributed to symptoms like eye irritation caused by dry air, poor ventilation, and fumes from frying. Furthermore, the average cooking temperatures for food and catering were found to be 74.3 °C and 55.80 °C, respectively.
ATP bioluminescence assay
Dishwashing practices in all the studied restaurants were based on poor habits and non-compliance with health guidelines. Environmental health inspectors did not address this issue in their inspection checklists. However, improper and unsanitary dishwashing is a significant route for the transmission of contamination to food. In this study, the dishwashing practices of restaurant staff were compared with the washing methods outlined in the health guidelines. ATP bioluminescence assay values were used to assess the contamination levels of food contact surfaces, including knives, cleavers, worktops, kebab skewers, chopping boards, meat grinders, spoons, forks, plates, and workers’ hands. Contamination was determined before cleaning using the ATP bioluminescence method, which identified high RLU values as indicative of contamination (Table 2). The average RLU values before cleaning for all tested surfaces indicated higher contamination levels, as reflected by the elevated RLU values (Table 2).
To reduce microbial contamination on food surfaces, both two-stage and three-stage dishwashing methods were employed. These methods did not involve the use of disinfectants. Hot water, with a temperature of 69.32 ± 15.55 °C, was used for washing dishes. As shown in Table 2, the highest contamination levels before cleaning (conventional washing) were observed on the chopping board and worktop, with average RLU values of 1700.89 and 1184.50, respectively. After cleaning, the highest contamination levels were found on the worktop and chopping board, with average RLU values of 49.54 and 20.71, respectively. Although the overall contamination removal efficiency for the worktop and chopping board was 95.82% and 98.78%, respectively, the actual cleanliness levels were 53.57% and 60.79%, based on the device’s standard (RLU values below 10 indicate cleanliness) (Table 3). The results of Monavvar Afzal-Aghaee et al. showed that 43.6% of the evaluated dishes were clean, 38.5% were dirty, and 17.9% were not clean enough. According to the ATP bioluminescence device results for tables, 23.1% of the tested tables were clean, 15.4% were cautionary, and 61.5% were dirty29. A comparison of our findings with those of Monavvar Afzal-Aghaee et al. indicates that the cleanliness of the tables in our study was 2.32 times higher29.
The method for detecting the contamination of food contact surfaces used in this study (ATP-bioluminescence assay) has shown using a Pearson correlation coefficient (Table S1). The correlation coefficient (R), after cleaning stage, reached a relatively high correlation for the worktop, worker’s hands, and meat grinder compared to before cleaning stage. Statistical analysis indicated a strong correlation in thorough washing (after cleaning) with R = 0.628 for the worktop, R = 0.709 for the worker’s hands, and R = 0.591 for the meat grinder, with a significant relationship at P < 0.05. The reason for this is that food residues and fats on the aforementioned surfaces were not completely removed by the regular method, and the reduction in contamination with this method ranged from 40 to 74%. However, after the three-stage washing process, due to the three stages of washing—removal of food residues and fats, washing with detergents in water at a temperature of 43 °C, and final washing at a temperature of 69 °C—the reduction in contamination on the aforementioned surfaces was observed to be between 91% and 98%. Additionally, the cleanliness level (RLU < 10) increased from 0 to 53.57% on the worktop, from 0 to 42.86% on the worker’s hands, and from 4 to 64% on the meat grinder. Nonetheless, the results in terms of cleanliness after the thorough washing phase were not satisfactory. The type of washing performed after the cleaning stage showed that the detection using the ATP-bioluminescence method resulted in a significantly lower number of RLU compared to the regular cleaning stage. This is due to the presence of bacteria or organic residues from the food containers and equipment resulting from regular washing, which were largely reduced through the three-stage washing method with hot water, a physical sanitization method, resulting in over 91% reduction in contamination across all measured parameters. Particularly since the ATP-bioluminescence assay can detect residual food substances, a surface that has been cleaned and sanitized may still contain some organic materials from food in contact with food contact surfaces. The ATP assay via bioluminescence detected a high level of RLU on the worktop and chopping board sections. This may be due to organic residues remaining from foods or chopped meat on these surfaces, with residues not eliminated by the hot water washing method. The results of this study showed high RLU levels even after the washing stage of the worktop and chopping board. This result can be attributed to the study by Verran et al. regarding the resistance of food residues to cleaning and their adhesion to the worktop and chopping board. Moreover, some bacteria may have resistance to sanitization, allowing them to survive and thus be detectable via the ATP-bioluminescence method in RLU30,31. Murphy et al., and Aycicek et al., found a good correlation between cleaning methods in detecting food contamination32,33.
After the cleaning stage, the average RLU values obtained from the ATP bioluminescence assay remained relatively high for the chopping board, worktop, and worker’s hand, whereas other food contact surfaces displayed comparatively low RLU values (Fig. 2). Additionally, both the chopping board and worker’s hand demonstrated relatively high contamination levels in the ATP bioluminescence assay, both before and after cleaning. The analysis also evaluated the effect of hot water temperature on dishwashing post-cleaning. No significant correlation was identified between the before- and after-cleaning stages and the hot water temperature for the worktop, as indicated by a p-value greater than 0.05. This suggests that temperature had a limited effect on cleanliness due to the uneven surface and material composition, resulting in suboptimal cleanliness levels for the worktop surfaces. Our findings revealed that smoother surfaces, like stainless steel, had lower contamination levels, even at non-elevated water temperatures for disinfection. Although Table 2 indicates a 95.82% reduction in contamination on the worktop surface, this reduction does not reflect complete cleanliness. The average RLU across all restaurants was 49.54, which is still considered contaminated according to washing and measuring device standards. Furthermore, the comparison of pre- and post-cleaning contamination on food contact surfaces, as assessed by the ATP bioluminescence assay (RLU), uncovered very low correlation coefficients (R values) ranging from − 0.126 to 0.220 before cleaning, which improved after the cleaning stage, ranging from − 0.390 to -0.618.
Some of the RLU results that appear low before cleaning may be due to excessive contamination, such as residual food materials that could obstruct light transfer to the detector. For example, remnants of meat on skewers or chopping boards, or certain food residues that interfere with luciferase activity in ATP, can result in reduced RLU readings. Contact surfaces with RLU levels exceeding 30 are considered contaminated32. The Public Health Laboratory Service (PHLS) in the UK, which was replaced by the Health Protection Agency in 2003, recommended that surfaces ready for use should not exceed the recommended RLU levels34. According to these guidelines, the cleanliness results obtained after the thorough washing stage for chopping boards and workers’ hand were unsatisfactory, as they contained over RLU 30, with readings of 39.29% and 28.57%, respectively. The results obtained for contact surfaces like skewers, spoons, forks, work tools (knives and cleavers), and plates were entirely satisfactory, while those for meat grinders were relatively satisfactory.
Additionally, 25% and 14.29% of the food contact surfaces were classified as being in a cautionary status (11–29 RLU), which is considered acceptable in terms of cleanliness. The lack of success in reducing microbial contamination through hot water washing can be attributed to the fact that, in 32.14% of the restaurants, the water temperature of the boiler or water heater did not reach the desired level, despite allowing sufficient time for contamination reduction during washing. In some cases, the equipment was also found to be damaged. Another issue was that the worktop and chopping board surfaces were not smooth due to the materials used (7.14% galvanized and 10.71% fiberglass, as indicated in Table 3), which resulted in relatively lower cleanliness levels on these surfaces. The highest average RLU values before the cleaning stage were recorded on the chopping board, worktop, worker’s hands, and meat grinder surfaces, while the plate exhibited the lowest RLU values. After the cleaning stage, the average RLU values were significantly reduced for surfaces such as the spoon and fork, plate, kebab skewer, and knives and cleaver (Fig. 2).

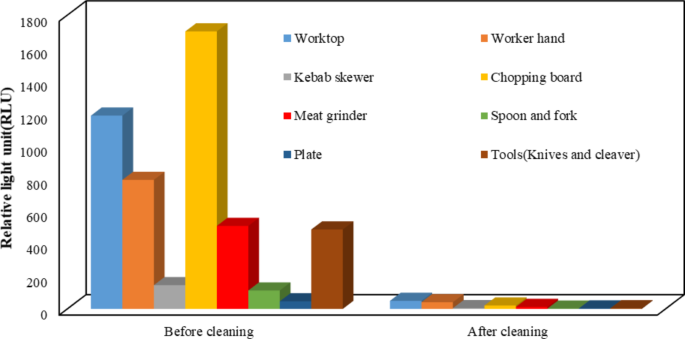
RLU values for food contact surfaces in the before cleaning and after cleaning.
Training on the hand washing method was conducted in accordance with the health guidelines established by the Ministry of Health of Iran. These guidelines allowed for a comparison of the washing techniques: the guideline-based method (the second stage of washing) and the conventional method (the first stage of washing), along with the pre-wash stage. A comparison across all restaurants revealed that conventional washing achieved an average reduction in contamination of 73.80% (207.18 RLU) compared to the pre-wash method, whereas the guideline-based washing method resulted in a contamination reduction of 94.79% (41.18 RLU) (Fig. 2). Furthermore, the washing method following the guidelines was 80.12% more effective in reducing contamination compared to the conventional method, demonstrating that the second stage of washing was 6.33% more effective at reducing hand contamination than the first stage.
It is essential to emphasize that a reduction in contamination on contact surfaces does not necessarily imply cleanliness since cleanliness is defined by specific standards. According to the device’s standard, 46.43% of the workers’ hands were classified as clean (under 10 RLU) (Table 4).
Several factors may describe the lack of correlation observed before cleaning food contact surfaces, such as worktops and chopping boards. These factors include the types of cleaning methods used, the materials comprising the food contact surfaces (e.g., stainless steel, galvanized metal, plastic), the varying levels of ATP present in microorganisms—which depend on their type and physiological state—the sensitivity of the ATP detection system, and the smoothness or roughness of the surfaces being cleaned35. Additionally, the differences between the two cleaning methods could be influenced by the locations of the swab sites. Even though the swabs were taken from nearby surfaces, they might contain varying levels of microbial contamination based on the specific site of contamination.
link